How to calculate risk-reward ratio for crypto trades
Last updated: September 10, 2026
Key Takeaways
- Suppose you buy at $50,000, place a stop at $48,500, and set a target at $53,000.
- Risking 2% of your account on one trade can change the math fast; a bad fill won’t show up in a screenshot.
- Example: entry 50,000 and stop 48,500 gives a risk of 1,500.
- Example: target 53,000 and entry 50,000 gives reward of 3,000.
Table of Contents
- What is risk-reward ratio in a crypto trade?
- Who this is for — and who should do something else
- How do I calculate risk-reward ratio step by step?
- What makes a good risk-reward ratio in crypto?
- The mistakes people actually make, and what they cost
- When does the standard ratio approach stop working?
- How I would sanity-check the number before placing the trade
- FAQ: the questions
The risk-reward ratio for a crypto trade is the distance from your entry to your stop-loss divided by the distance from your entry to your take-profit. Miss those three prices before you enter? Then you do not have a risk-reward ratio yet — you have a guess. In crypto risk-reward ratio terms, the point is not to sound precise; it is to know your downside and upside before money is on the line.
I’m writing this for someone who already knows how to place a trade, understands what a stop-loss and take-profit are, and wants a clean way to size the opportunity before risking money. And I’m going to be blunt about who should not try this alone: if you are trading with borrowed money, using options or perpetual futures, or you do not know how liquidation works, get qualified financial advice for your own situation. This is information, not financial advice.
Who this is for — and who should do something else
This method fits spot traders and cautious derivatives traders who can pin down an entry price, a stop level, and a target level in advance. It assumes you can read a chart on a 5-minute, 1-hour, or daily timeframe, and that you know the difference between a limit order and a market order. No fancy tool is needed; a notebook or a spreadsheet is enough for calculating crypto risk-reward ratio.
Not for everyone. People who keep moving stops after entry because they “feel” the market should turn will fight this method the whole way, and so will anyone with no plan for where the trade is wrong. A risk-reward ratio only works if the “risk” side is real. If your stop is so wide that a normal 3% swing won’t touch it, the ratio can look attractive while the trade still exposes you to a large loss. If your stop is so tight that ordinary spread and noise can hit it, the ratio is decorative.
For crypto, the assumptions need a reality check too. A 0.5% move in bitcoin on a calm day is not the same as a 0.5% move in a thin altcoin pair at 2 a.m. UTC. Liquidity, exchange fees, and slippage matter. A clean chart on TradingView can hide a messy order book on the exchange where you actually trade. For more on execution quality and market mechanics, see the SEC’s Investor.gov guidance on order types and the CFTC on derivatives risk.
Honestly, I would not use this method as a standalone decision rule for long-term investing or for illiquid micro-cap tokens. In those cases, position sizing, custody risk, and project-specific risk matter more than a neat ratio. The ratio still has value, just not the whole answer. Apples and oranges.
What is risk-reward ratio in a crypto trade?

Risk-reward ratio is the amount you stand to lose if the stop-loss is hit versus the amount you stand to gain if the take-profit is hit. Usually, people write it as risk : reward, such as 1 : 2 or 1 : 3.
The formula is simple:
Risk-reward ratio = (Entry price – Stop-loss price) : (Take-profit price – Entry price) for a long trade.
For a short trade, the direction flips, but the logic stays the same.
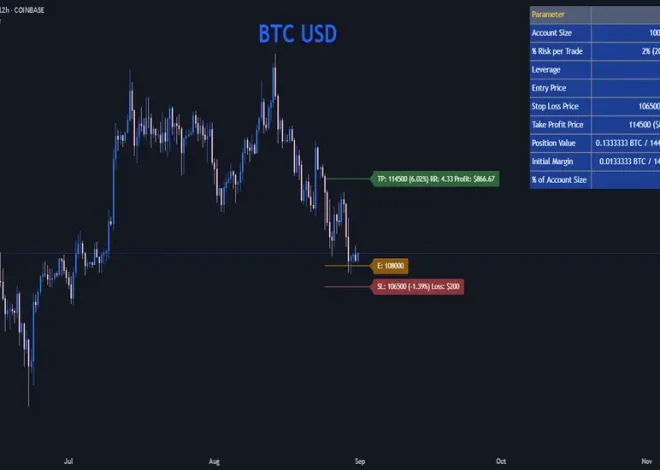
Here is a plain example. Suppose you buy at $50,000, place a stop at $48,500, and set a target at $53,000.
- Risk = $50,000 – $48,500 = $1,500
- Reward = $53,000 – $50,000 = $3,000
- Risk-reward ratio = 1,500 : 3,000 = 1 : 2
That means you are risking $1 to try to make $2, before fees and slippage.
A lot of generic articles stop there. The missing piece is that the ratio is not a prediction. A 1 : 3 setup can still lose most of the time. A 1 : 1 setup can still be profitable if the win rate and costs are favorable. The ratio only tells you the payoff shape of one trade. It does not tell you whether the trade is good.
That distinction matters in crypto because costs are not trivial. Exchange fees, spread, funding on perpetuals, and slippage can turn a tidy 1 : 2 into something weaker. If you risk 2% of your account on a trade, a bad fill can change the math in a way a chart screenshot won’t show, and the effect can matter more on fast or thin markets.
How do I calculate risk-reward ratio step by step?
Fix the entry, stop, and target first. Then measure the distance from entry to each level in the same units. I use price units or percentages, but I keep the method consistent within one trade.
- Choose the direction of the trade. Decide whether it is a long or a short, and write the entry price as a single number, such as 68,250 or 3,420. Verify that you are not mixing spot and derivative pricing. A mismatch here makes the rest of the calculation useless.
- Set the invalidation point. Place the stop-loss where the trade idea is wrong, not where the loss feels small. Use a specific level, such as below a swing low, above a resistance shelf, or beyond a volatility band. Make sure the stop is outside normal noise on your timeframe; if a 1-hour candle can hit it easily, it is probably too tight.
- Set the profit target. Choose a price where you would realistically take profit, such as the next resistance zone, measured move, or prior high/low. Check that the target is reachable before major overhead supply or support. If the target sits inside a wall of prior price rejection, the setup is weaker than it looks.
- Measure the risk distance. Subtract the stop from the entry for a long, or subtract the entry from the stop for a short. Example: entry 50,000 and stop 48,500 gives a risk of 1,500. Verify that the number is positive and not absurdly small. If the risk is smaller than the average spread plus fees, you are underestimating real risk.
- Measure the reward distance. Subtract the entry from the target for a long, or subtract the target from the entry for a short. Example: target 53,000 and entry 50,000 gives reward of 3,000. Check that the target is on the correct side of the entry. A negative result means the trade direction or numbers are wrong.
- Divide reward by risk if you want a multiple. In the example, 3,000 divided by 1,500 equals 2. That is a `2R` trade, meaning the reward is twice the risk. Verify that you are not reversing the fraction. Many traders accidentally compute risk divided by reward and then misread the result.
- Convert to percentage if that is how you manage capital. Risk percentage = risk distance ÷ entry. Reward percentage = reward distance ÷ entry. Example: 1,500 ÷ 50,000 = 3% risk; 3,000 ÷ 50,000 = 6% reward. Verify that both percentages are based on the same entry price. If you compare one trade in dollars and another in percent, the numbers will mislead you.
- Adjust for fees and slippage. Add your expected round-trip trading costs to the risk side, and subtract them from the reward side. On most exchanges, the exact fee depends on venue and account tier, so check the current fee schedule before you trade. Verify that the net ratio still makes sense after costs. If not, the setup may only work on paper.
A second worked example helps because short trades trip people up. If you short at $2,400, place a stop at $2,520, and target $2,160:
- Risk = $2,520 – $2,400 = $120
- Reward = $2,400 – $2,160 = $240
- Ratio = 1 : 2
The arithmetic changes direction, but the logic does not.
What makes a good risk-reward ratio in crypto?
A good risk-reward ratio is one that still works after you include the real market conditions of the trade. I care less about a headline number like 1 : 5 and more about whether the stop and target are placed at levels the market actually respects.
As a rule of thumb, many traders look for at least 1 : 2, but that is not a law and it is not universal. It is only useful if the stop is logical and the target is realistic. A 1 : 2 setup with a stop under a clear swing low and a target at the next resistance zone is much better than a 1 : 4 setup built on random levels that the market can ignore.
Three checks matter:
- Structure: Does the stop sit beyond a level that should invalidate the idea?
- Reachability: Is the target close enough to be hit before the chart structure breaks?
- Costs: Do fees, spread, and slippage leave enough net reward?
That last one matters more in crypto than in many traditional markets because some pairs are thin and some moves are fast. A ratio that looks good on a calm spreadsheet can fail on a volatile 15-minute candle. Paper profits. Real pain.
This is also where a lot of traders fool themselves with percentage thinking. A 10% target sounds attractive until you realize the coin has already moved 8% in two candles and is sitting under resistance. The ratio is only useful when tied to a real market level, not an arbitrary percent.
The mistakes people actually make, and what they cost
The biggest mistake is using a ratio without a real stop-loss. That turns the calculation into theater, because the “risk” is whatever the market decides. The correct alternative is to define the stop first and only then compute the ratio.
A second mistake is placing the stop at an obvious round number, such as exactly 50,000 or exactly 2,000. Those levels often attract stop runs. The consequence is getting taken out by normal market probing. Better to place the stop beyond the structure that invalidates the setup, not just beyond a neat number.
A third mistake is ignoring fees and slippage. On a low-liquidity altcoin or a fast-moving market, the difference between the chart price and your fill can be meaningful. That weakens the real reward and enlarges the real risk. The correct alternative is to estimate your round-trip cost before entry and build it into the math.
A fourth mistake is chasing a huge ratio with a tiny target probability. A 1 : 6 trade can look smart on paper and still be poor if the target sits far beyond the current range. The consequence is a long string of small losses while waiting for the one oversized winner. The better alternative is to pair the ratio with a realistic chart level and a sensible trade frequency.
A fifth mistake is comparing trades with different timeframes as if the ratio alone decides everything. A 1 : 2 swing trade over 5 days is not the same animal as a 1 : 2 scalp over 10 minutes. The correct alternative is to compare like with like: same market, same venue, same timeframe, same fee structure.
When does the standard ratio approach stop working?
It stops working when the market structure is too unstable, too thin, or too fast to define a reliable stop and target. In those cases, the ratio can be calculated, but the result is too fragile to trust.
Very wide intraday candles, such as 3% to 5% swings in an hour: your stop may get hit by noise rather than invalidation — use a larger timeframe, or skip the trade if you cannot tolerate the wider stop.
Illiquid pairs with poor order-book depth: slippage can distort both entry and exit — reduce size materially or avoid the pair, because the chart price may not be the price you actually get.
Perpetual futures with high leverage: liquidation risk can arrive before your stop is executed — keep leverage low enough that the stop, not liquidation, controls the loss, or get advice from a qualified professional.
News events, exchange outages, or violent macro headlines: the chart can gap through your levels — stand aside until price action normalizes, because a clean ratio cannot protect you from execution failure.
Trades defined only by a percentage target, such as “I want 8% upside”: the target is arbitrary and may ignore resistance — anchor the target to a chart level or measured move instead.
Options and structured products: payoff is not linear, so a simple entry-stop-target ratio does not capture the risk — use the instrument’s own payoff model, and if needed, consult a qualified adviser.
For derivatives, one more caution: funding rates, maintenance margin, and liquidation thresholds can matter more than the ratio you write on paper. Those details vary by exchange and by contract. If you do not understand them, the standard spot-trade ratio is the wrong tool. The Investopedia and CME Group explain why leverage and contract terms change outcomes.
How I would sanity-check the number before placing the trade
I would check four things before I let the order hit the market. First, I would confirm that the stop is at the place where the trade idea is wrong, not just where pain begins. Second, I would ask whether the target sits at a level where the market has room to travel. Third, I would add fees and expect some slippage if the market is moving quickly. Fourth, I would compare the ratio with the setup quality. A clean 1 : 2 beat-up range break is often better than a stretched 1 : 5 trade into heavy resistance.
A useful habit is to write the numbers down before entry in this format:
- Entry: 50,000
- Stop: 48,500
- Target: 53,000
- Risk: 1,500
- Reward: 3,000
- Ratio: 1 : 2
- Costs: exchange fee plus expected slippage
That takes less than 1 minute and protects you from changing the story mid-trade. If you cannot state the trade in six lines, the setup is probably not ready.
FAQ: the questions