Portfolio Tracking and Performance Analytics: The Complete Guide
Last updated: September 10, 2026
Key Takeaways
- Put $20,000 in before a rally, and the account can look brilliant even when the strategy was merely average.
- For a first pass, 12 months or more is the safer window if you want anything stable.
- Spread your investments over 18 months, and MWR shows whether those dollars were placed well.
- One missing account — or one counted twice — can skew totals by 5%, 20%, or even more, depending on size.
Portfolio tracking and performance analytics — the complete guide — tells you whether your investments are doing what you think they are doing, and whether the numbers you see are real or warped by cash flows, fees, taxes, or timing. This guide to portfolio tracking and performance analytics is for an individual investor, adviser, or finance-savvy employee who already has an account statement, a brokerage login, a fund statement, or a spreadsheet and wants to measure results correctly rather than just watch balances move. It is information, not financial advice; your own situation can be different, so a qualified adviser is worth consulting before you make money decisions that depend on these numbers.
Who this is for — and who should do something else
Anyone asking, “What did my portfolio actually do?” fits here. Easy question. Hard answer. A portfolio can rise because markets rose, because you added cash, because dividends were reinvested, because a currency moved, or because a manager took more risk than you realized. Portfolio tracking and performance analytics is the discipline that separates those effects.
I’m assuming you already have at least one of these: brokerage statements, fund statements, a 401(k) or pension account, CSV exports from a platform, or a spreadsheet with transactions. Also, you should know the basic labels for what you own — stocks, bonds, mutual funds, exchange-traded funds, cash, and maybe private assets. The formulas can wait. What cannot wait is the transaction history. Without dates and amounts, the whole exercise turns into guesswork.
This is the right tool if you want to answer questions like: Did my asset allocation drift? Did fees swallow a large share of returns? Did one account outperform another because of skill or because I added money at the wrong time? It is also useful if you manage money for a household and need to compare what happened across taxable and retirement accounts. For portfolio tracking and performance analytics, that cross-account view is often where the real answer appears.
Quick check: this is not for checking today’s balance. A balance screen gives status; performance analytics gives interpretation. And it is not the right tool if you are making a one-off decision about whether to pay off debt, build an emergency fund, or change your risk tolerance. Those questions need budgeting, liquidity planning, and often professional advice. If your finances are complex enough that taxes, employer stock, stock options, or concentrated positions matter, consult a qualified adviser or tax professional before relying on DIY portfolio tracking and performance analytics, since the numbers can be easy to misread.
Two standards matter most here: GIPS, the Global Investment Performance Standards from CFA Institute, and the standard definitions of time-weighted return and money-weighted return. If a report does not say which return method it uses, the number may still be usable, but it is not yet interpretable. That missing label trips people up all the time.
What portfolio tracking and performance analytics actually measure
Portfolio tracking tells you what you own and how those holdings changed over time. Performance analytics tells you how much return those holdings produced, how that return was built, and how much risk you took to get it. Similar? Yes. The same? No.
The core object in portfolio tracking is the position: a holding, quantity, cost basis if relevant, and value on a date. In performance analytics, the center of gravity is the return series: the sequence of gains and losses measured over fixed periods, usually daily, monthly, quarterly, or annually. A return series lets you compare your portfolio with a benchmark, with another account, or with your own target allocation.
People usually tangle up three measures:
- Gain/loss in dollars: current value minus original cost or prior value.
- Time-weighted return (TWR): a return measure that removes the effect of external cash flows, so you can compare manager skill or strategy behavior across accounts.
- Money-weighted return (MWR), also called internal rate of return or IRR in many contexts: a return measure that reflects the timing and size of your contributions and withdrawals.
That difference matters. Add $20,000 before a market rally, and your portfolio value may look strong even if the strategy was average. Pull money out before a gain, and the ending balance can understate the underlying result. TWR answers “How did the invested assets perform?” MWR answers “How did my actual dollars do?” Both are legitimate; each answers a different question. A generic article often pretends one number can do both jobs. It cannot.
Attribution belongs here too. At a simple level, attribution asks where return came from: asset allocation, security selection, sector exposure, style tilt, currency exposure, duration in bonds, or leverage. Full attribution gets technical fast. No PhD needed. But you do need to know the difference between “my account is up 8%” and “my equity sleeve outperformed its benchmark by 1.2 percentage points while my cash drag cut total return by 0.4 points.”
Because attribution separates sources of return, it is easier to see whether a result came from skill, risk, or timing. For a plain-English overview, see the CFA Institute materials on performance measurement and attribution, and for the return definitions themselves see the SEC’s investor guidance on compound returns and GIPS. Judgment still matters, since one quarter can be noisy even when the math is correct. Like trying to judge a movie from one trailer.
Costs sit in the same bucket. Fees, spreads, taxes, and turnover all reduce the investor’s realized result. A portfolio can show a respectable gross return and still deliver a weak net outcome. A good tracking system should make those frictions visible, even if it cannot fully model taxes in every country. Tax rules differ by country and change often, so do not assume a platform’s default tax view is correct for your jurisdiction.
How do I track a portfolio without making the numbers lie?
You track it by reconciling holdings, transactions, cash flows, and valuation dates on a consistent basis, then choosing the correct return method for the question you are asking. The mechanics matter more than the dashboard.
Here is the process I would use.
- Define the portfolio boundary. List every account you want included: taxable brokerage, retirement accounts, joint accounts, cash sweep, and any managed subaccounts. Use a 1-page inventory with account name, custodian, base currency, and start date. Verify that each account has a single owner for reporting purposes. One account omitted, or counted twice, can distort totals by 5%, 20%, or more depending on size.
- Choose the measurement date and frequency. Pick one reporting cadence, usually monthly for household investing and daily or weekly for active monitoring. Lock the valuation date to market close, end of month, or a broker’s official statement date. Verify that every account uses the same cut-off. A problem appears when one statement is as of the 28th and another is as of the 31st, which creates false gains or losses from timing alone.
- Import all transactions. Capture buys, sells, contributions, withdrawals, dividends, interest, splits, fees, and transfers. Use exact dates and gross amounts, not just ending balances. Verify that each transaction has a direction and a quantity where applicable. A transfer entered as a contribution in one place and a sale in another breaks cash-flow analysis and can double-count return.
- Normalize prices and currencies. Record each security in its trading currency, then convert to a portfolio base currency at the correct FX rate for the chosen date. Use the same rate source consistently; many platforms use end-of-day market rates or a vendor feed. Verify that a foreign stock, foreign bond, or international fund is not being valued in the wrong currency. A EUR asset treated as USD can make performance look stronger or weaker by the currency move alone.
- Compute market value and cost basis separately. Market value is current price times quantity. Cost basis is what you paid, adjusted for rules in your jurisdiction. Verify that unrealized gain/loss is not mistaken for performance. A problem appears when a rising position is treated as “return” even though some of the movement came from an additional purchase at a higher price. In practice, check the treatment carefully and consult a professional when the position has corporate actions, tax lots, or other complexities.
- Calculate time-weighted return for strategy analysis. Break the period into subperiods at each external cash flow, then compound the subperiod returns. Verify that deposits and withdrawals are treated as external, not as gains or losses. A simple before-and-after balance formula during a year with large contributions will overstate or understate skill; that math stops working fast. For published standards, see GIPS and the CFA Institute guidance on time-weighted return.
- Calculate money-weighted return for personal outcome. Use IRR or XIRR on dated cash flows, including the ending market value as a final positive cash flow. Verify that the solver converges and that the sign convention is consistent. A problem appears when the tool gives an absurd annualized rate because all cash flows happen in a short span or the signs were entered backwards. If the portfolio has irregular flows or you are unsure how to interpret the result, consult a professional and compare the calculation with your platform’s methodology.
- Set a benchmark and a target mix. Pick a benchmark that matches the portfolio’s purpose: a broad equity index for stock-heavy portfolios, a balanced benchmark for multi-asset portfolios, or a custom blend if the allocation is unusual. Verify that the benchmark’s risk profile is close enough to be meaningful. Comparing a cash-heavy portfolio with an all-equity index is a bad fit; the mismatch is mostly about asset mix.
- Review attribution and risk metrics. Check allocation effect, selection effect, volatility, drawdown, and concentration. Use 12 months or longer for the first pass if you want anything stable. Verify that one sector, issuer, or fund is not dominating the result. A good-looking total return can hide a 30% or 40% drawdown that you would not tolerate again.
A spreadsheet can do this, and many platforms can too. The point is not the tool; the point is disciplined inputs. Messy inputs? Even the fanciest software will still spit out polished nonsense.
Which return number should I trust?
Trust the return number that matches the question, not the one that looks largest. So: TWR for skill and strategy, MWR for your actual dollars, and simple gain/loss only for a quick check.
Time-weighted return strips out the effect of external cash flows. That makes it the standard choice when comparing a fund, manager, or strategy across time, because the manager did not control when you added money. If a portfolio took in a large contribution just before a rally, TWR prevents that cash timing from flattering the result. GIPS uses TWR as a core reporting concept for this reason. See also the SEC’s investor materials on how returns can change with cash-flow timing.
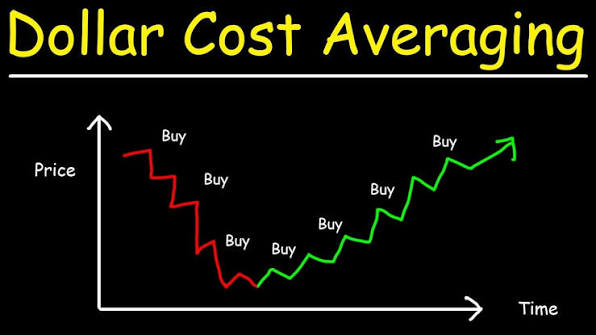
Money-weighted return includes cash-flow timing. Invest gradually over 18 months, and MWR tells you whether those dollars were deployed well. It is the better number for a household investor asking, “How did my decisions and timing affect me?” A person who contributed heavily during a down market may see a strong MWR even if the visible balance chart looked ugly for a while. The reverse can also happen. For portfolio tracking and performance analytics, that timing lens is often the one that matters most to the owner.
The catch is sensitivity. One big contribution or withdrawal can move MWR sharply. That sensitivity is not a bug; it is the point. But it also means MWR is poor for comparing two managers if one account owner added or removed cash at a different pace.
There is a third distinction worth making: geometric return versus arithmetic return. Geometric return compounds period by period and is what most investors need for long-run portfolio results. Arithmetic return averages simple periodic returns and is better for estimating expected return over one period, not for describing compounded growth over years. A report that quotes an average annual return without saying whether it is geometric or arithmetic is incomplete.
For most readers, I would treat TWR as the performance lens and MWR as the personal outcome lens. If the two numbers are close, the cash-flow timing was not a major driver. If they are far apart, your timing mattered, for better or worse. A few percentage points of spread is not unusual in accounts with frequent contributions; the exact gap depends on flow size and volatility.
One more caution: annualization can mislead when the observation window is short. A 3-month return annualized to a big number can look exciting, but it is mostly a mathematical scaling of a short interval. Don’t rank a 3-month annualized figure above a 5-year compounded return unless the time frame really is comparable.
What should be on a good performance report?
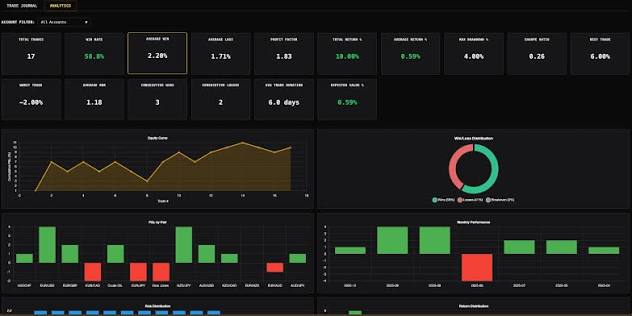
A good report shows return, risk, cash flows, and composition on the same page, usually over 1 month, 3 months, year to date, 1 year, 3 years, and since inception. It should also show the benchmark, the benchmark method, and the currency used.
At minimum, I want to see:
- Beginning value, ending value, and net external flows
- TWR and MWR
- Contribution by asset class, account, or strategy sleeve
- Benchmark return over the same period
- Fees and, where relevant, estimated transaction costs
- Volatility or standard deviation, which is the spread of returns around the average
- Maximum drawdown, the worst peak-to-trough decline over the period
- Concentration by issuer, sector, or fund
- Currency exposure if any holdings are foreign
- A notes section explaining splits, corporate actions, and methodology
A report without methodology is decoration. If the report says “portfolio return” but not whether it uses TWR, MWR, daily valuation, monthly valuation, or modified Dietz approximation, then the number is not fully interpretable. Modified Dietz is a common approximation method that estimates return when exact daily values are unavailable. It is practical, especially for monthly reporting, but it is still an approximation. Fine if disclosed. A problem if hidden.
The best report for a household investor is often simpler than the best report for a fund analyst. A family portfolio may need an account-level view because retirement, taxable, and cash accounts serve different jobs. A concentrated equity portfolio may need issuer concentration and sector exposure. A bond-heavy portfolio may need duration, credit quality, and yield-to-maturity. The report should match the risks you actually carry, not the risks a generic template is good at displaying.
I would also include a one-line summary of what changed this period. If the answer is “small equity gains and a cash contribution,” that is useful. If the answer is “one tech position moved the account and the rest was flat,” that is more useful. Clear labels reduce the chance that a reader confuses market movement with new savings.
The mistakes people actually make, and what they cost
The most common mistakes are not mathematical. They are classification mistakes.
-
Mixing cash contributions with performance.
Consequence: you can think you earned a return you actually funded yourself, or think you lost money when the real issue was a contribution made before a decline.
Correct alternative: separate external cash flows from investment returns and use TWR for strategy analysis. -
Ignoring fees and transaction costs.
Consequence: gross return looks fine while net return is lower, especially in high-turnover accounts, active funds, or portfolios with trading spreads.
Correct alternative: track expense ratios, advisory fees, custody fees, spreads where available, and trading costs as a separate drag line. -
Comparing against the wrong benchmark.
Consequence: you may conclude a portfolio outperformed or underperformed when the benchmark simply had a different asset mix.
Correct alternative: use a benchmark that reflects the portfolio’s risk profile, such as a blended benchmark built from relevant asset-class indices. -
Overstating precision.
Consequence: tiny return differences get treated as meaningful when they may be caused by valuation timing, stale prices, or rounding.
Correct alternative: round consistently, disclose the valuation frequency, and treat small differences as noise unless they persist over multiple periods. -
Treating one year as a verdict.
Consequence: a short cycle can make a sensible strategy look broken or a poor one look brilliant.
Correct alternative: review 3-year and 5-year windows where available, and look at drawdowns as well as average return. -
Forgetting corporate actions and cash-like events.
Consequence: stock splits, mergers, spin-offs, special dividends, and return of capital can distort cost basis and performance if entered badly.
Correct alternative: check corporate action notices and reconcile them against the statement, especially after a split ratio like 2-for-1 or a merger event.
The hidden cost in all of these errors is decision quality. A bad report does not just mislabel the past; it can push a future allocation, tax decision, or withdrawal rate in the wrong direction. That is why I am so strict about classification before interpretation.
When does the standard approach not apply?
The standard approach needs modification when cash flows are large, assets are illiquid, valuations are stale, or the portfolio mixes very different instruments. In those cases, the method must match the asset, not the other way around.
Large, irregular contributions or withdrawals: TWR may still be the right analytical measure, but MWR will swing hard and may overemphasize one deposit or withdrawal — use both numbers and interpret the gap as a cash-flow effect.
Illiquid assets such as private equity, private credit, real estate, or collectibles: monthly marks may be estimated, not traded prices — treat return figures as approximate and place more weight on realized cash flows and independent valuations.
Derivatives, leverage, or margin: simple portfolio return calculations can mislead because exposure can exceed equity; check both the unlevered and levered view.